


What kinds of AI technologies does this survey cover?
The purpose of this survey was to poll American attitudes specifically about the new class of artificial intelligence known as Generative AI. Such technologies include ChatGPT, Bing Chat, Midjourney, and Adobe Firefly. To reinforce this concept, many of the questions specifically mention Generative AI technologies. Additionally, there was a preamble at the beginning of the survey which defined its scope. All survey respondents were shown this preamble before continuing on to the questions. The preamble read as follows:
The following questions are about Generative Artificial Intelligence (AI). Generative AI is a new kind of technology. It can produce things like text, computer code, images, music, voices, and videos. It does this by getting some guidance from humans. For example, you might have heard of AI systems like ChatGPT. It can chat like a human. Another tool, called Midjourney, can make images based on text descriptions entered by a person.
These Generative AI tools learn from a lot of data. This data could be books, articles, pictures, or songs. From this data, the AI learns patterns. After learning, they can create new content. This content is similar to the data they learned from. For example, if the AI learned from many books, it could write a story. If it learned from images, it can create new images. The same goes for music, computer code, and simple videos.
These questions aren’t about all AI. They don’t cover things like self-driving cars or facial recognition. They’re only about new Generative AI that can create human-like content. Keep that in mind when you answer the questions.
What questions were asked?
A friendly version of the survey introduction and questions can be found here.
Is this survey really nationally representative of all Americans?
Yes. The 2023 Generative AI and American Society Survey was administered by the National Opinion Research Center (NORC) at the University of Chicago using their AmeriSpeak panel and results are weighted to be nationally representative. It is one of the highest-quality survey options available in the United States. NORC surveys are routinely cited in the media, with over 1,400 total mentions. A technical overview of the AmeriSpeak panel can be found here. For more details see the FAQ question below, “Did this survey use probability sampling?”
Here is NORC’s summary of the AmeriSpeak panel:
Since its founding by NORC at the University of Chicago in 2015, AmeriSpeak has produced more than 900 surveys, been cited by dozens of media outlets and become the primary survey partner of the nation's preeminent news service, The Associated Press. Our sampling captures a true picture of America, providing better representation than other panels for hard-to-reach populations, including low-income households, less educated persons, young adults, rural households, persons who are less interested in the news, and social and political conservatives. AmeriSpeak is the most scientifically rigorous multi-client panel available in the U.S. market.
What are the survey details?
The survey was administered by the National Opinion Research Center (NORC) at the University of Chicago using the AmeriSpeak Omnibus panel. A technical overview of the AmeriSpeak panel can be found here.
Additional details:
The dates of the survey were 24 August 2023 (a Thursday) to 28 August 2023 (a Monday).
The survey was administered to U.S. adults ages 18 and over. In this survey the youngest respondent was 18 and the oldest was 95.
In terms of the device used to respond to the survey, 30% used a desktop, 5% used a touchtone phone (those without internet), and 65% used a mobile device like a smart phone.
The survey was weighted to ensure it is nationally representative.
The margin of error is +/-3.87.
The sample size was 1,147.
Questions were randomized to try and minimize certain types of response bias. See specific FAQ below for randomization details.
What were the response rates to the survey?
Note that the American Association for Public Opinion Research (AAPOR) recommends the following approach to interpreting survey response rates:
Consumers of survey results should treat all response rates with skepticism, since these rates do not necessarily differentiate reliably between accurate and inaccurate data. Instead consumers should pay attention to other indicators of quality that are included in reports and on websites, such as insignificant levels of bias, low levels of missing data, and conformity with other research findings.
Nonetheless AAPOR also recommends reporting response rate as a best practice. A detailed breakdown of the 2023 Generative AI and American Society Survey response rates can be found below:
Fielding Dates: August 24th to August 28th
The survey was open for responses during these dates.
Released Sample: 6,667
The survey was sent out to a sample of 6,667 people.
Completes: 1,147
1,147 people completed the survey in full.
Recruitment Rate: 21.1%
This represents the portion of people who started the survey out of the initial sample. Calculated as (People who started the survey / Released Sample) * 100. This helps to understand the engagement level.
Retention Rate: 78.7%
This shows the portion of people who completed the survey once they started. Calculated as (Completes / People who started the survey) * 100. This can indicate how straightforward or challenging the survey was to complete.
Completion Rate: 17.2%
This indicates the portion of people who completed the survey out of the initial sample. Calculated as (Completes / Released Sample) * 100. This provides a broad view of the survey’s effectiveness.
AAPOR3 Response Rate: 2.9%
AAPOR stands for American Association for Public Opinion Research. The AAPOR3 rate is a specific formula for calculating the response rate.
DEFF: 1.79
This typically refers to the Design Effect, which measures how much the survey design deviates from a simple random sample. It's often used to adjust the Margin of Error (MOE).
MOE: +/- 3.87
The Margin of Error means that the survey results can deviate by this percentage in either direction. For example, if 50% of respondents say "Yes" to a question, the real answer, if every person in the population were asked, would likely fall between 46.13% and 53.87%.
Why does the sample size vary between questions?
Respondents have the option to skip any question or to refuse to answer any question (these are two distinct options). The number of respondents that skipped a question ranged from 2 to 27 depending on the specific question, with an average of 16 respondents skipping per question, or just over 1% of the total sample size. Although respondents also had the option to refuse to answer questions, only one respondent exercised this option for a single question (the question about artist compensation).
Additionally, when breaking down specific response options or demographic groups the sample size will vary.
Did this survey use probability-based sampling?
Yes.
Surveying an entire population can be costly, time-consuming, and arduous. Sampling a smaller group from within that population is usually a more realistic option. The purpose of a survey, therefore, is to extrapolate the views of a small group to the views of an entire population. (A survey that includes all members of a population is called a census). There are two broad methodologies to select participants for a survey:
Probability-based sampling. Probability-based sampling uses a so-called “sampling frame,” a list of the entire population that theoretically could be included in the survey sample. Survey participants are then selected at random from the list. This allows for a direct mathematical calculation to extrapolate the responses of the survey participants to the views of the entire population of interest (called “weighting” the survey). The National Opinion Research Center (NORC) AmeriSpeak panel is a probability-based survey. For technical details see this white paper on AmeriSpeak recruitment.
Non-probability sampling. Surveys using non-probability sampling are typically cheaper, faster, and easier to conduct than those based on probability sampling. A common type of survey based on non-probability sampling is an online opt-in connivence sample. For instance, a questionnaire a company may send out to all customers that purchased a product within the past month. There are methods to weight surveys based on non-probability sampling, but unlike probability-based sampling there is no universal mathematical approach that can be used in all cases.
Both probability and non-probability sampling methods have their respective merits and appropriate applications. However, when the objective is to acquire results that are representative of the entire population, such as in the Generative AI & American Society Survey, probability-based sampling is generally favored. This method ensures every individual within the population has an equal chance to be included, hence it mitigates the risk of underrepresenting certain groups that is often inherent in non-probability convenience samples.
For an accessible overview of how probability and non-probability sampling works with specific, easy-to-follow examples, see “Sampling: Why and How of it?” For an overview of probability and non-probability sampling considerations see a relatively friendly overview from the American Association of Public Opinion Research, "Summary Report of the AAPOR Task Force on Non-Probability Sampling" which appeared in the Journal of Survey Statistics and Methodology in 2013.
Numerous studies have compared the accuracy of probability and non-probability sampling methods. A full survey of that literature is beyond the scope of this article, but I have provided a short list of articles for those who are interested:
In September of 2023 the Pew Research Center compared three probability-based surveys with three non-probability surveys on a benchmark of 28 variables. The study found that, “Opt-in samples are about half as accurate as probability-based panels.” This was a follow-up to their 2016 analysis on the same topic.
A 2016 discussion paper called “Establishing the accuracy of online panels for survey research” compared 18 opt-in surveys and three probability-based surveys against a benchmark government registry of all 16 million Dutch residents (the so-called Municipal Basic Administration, or MBA). The paper summarized its findings as follows:
The nonprobability samples yielded less accurate estimates of proportions and notably different relations between variables than did the probability samples, and these differences were not eliminated by weighting. These findings reinforce the value of scientific, random sampling to permit generalizing research findings to a larger population.
A 2020 study compared official data collected by the government of Finland with two non-probability river samples, one with a group of users recruited from Facebook and another recruited via a link on the website of Finish broadcasting company YLE. All three groups were asked about their experience with cyberhate and cyberharrasment. Official data show that just 5% of youth have been exposed to cyberharrasment, but the Facebook survey pegged the figure at 36% (7 times higher) while the YLE survey resulted in an estimate of 30% (6 times higher). Statistical adjustments to weight the river samples did not impact the Facebook estimate, but reduced the YLE estimate to 21% (still 4 times higher). Figures for cyberhate were similarly skewed. The study emphasized that non-probability samples have their place, noting that, “[N]on‐probability online surveys do not replace probability surveys, but augment the researcher's toolkit with new digital practices, such as exploratory studies of small and emerging non‐demographic subpopulations.”
An analysis in 2021 by Peter K. Enns and Jake Rothschild found that non-probability samples can perform well in certain scenarios, actually out-performing probability-based samples in 2020 election polls. However, the analysis was done at the aggregate level and no demographic segmentation was analyzed.
A 2022 study compared attitudes of water quality using two opt-in surveys — one from survey provider Qualtrics and oen Amazon’s Mechanical Turk service — against a probability sample. The study found, “The samples differ in some key demographics, but measured attitudes are strikingly similar…Overall, the evidence is mixed, with some key differences but many similarities across samples.”
The 2016 discussion paper cited above concisely summarized when the results of probability and non-probability samples are expected to differ:
In theory, opt-in samples may sometimes yield results that are as accurate as probability samples, assuming that the factors that explain a population member’s presence or absence in the sample are uncorrelated with variables measured in a study and the magnitudes of associations between pairs of variables.
What is Total Survey Error and how did the survey minimize it?
Every survey inherently has imperfections and is susceptible to a spectrum of errors collectively known as Total Survey Error (TSE). While the emphasis of probability-based sampling is fundamentally on minimizing sampling error, it is crucial to recognize that several other types of error can affect a survey’s accuracy. Examples of errors within the TSE framework include:
Construct Validity Error: Does a survey question accurately measure the intended concept?
Measurement Error: Are respondents providing accurate answers to the questions?
Processing Error: Is the data accurately analyzed and represented in the survey results?
Coverage Error: Does the sampling frame encompass the entire target population?
Sampling Error: Is the sample an accurate representation of the target population?
Nonresponse Error: Are the results biased due to the systematic absence of responses from certain segments of the target population?
All of these errors can impact the reliability and validity of survey results. In administering the 2023 Generative AI and American Society Survey I relied on NORC to help minimize processing error, coverage error, and sampling error. I attempted to minimize construct validity error and measurement error via careful crafting of the question wording, ordering, and randomization. Details are provided in the FAQs that follow. Any nonresponse error remains, see the “What were the response rates to the survey?” FAQ for details.
For a good history and overview of Total Survey Error, see “Total Survey Error: Past, Present, and Future.”
Who wrote the survey questions?
The survey was written by James McCammon, a really cool, smart guy and author of 96layers. Questions went through multiple reviews with the National Opinion Research Center as well as a single round of reviews with three volunteer reviewers from the AI community that I cold emailed (reviewers were affiliated with the Centre for the Governance of AI, UC Berkeley AI Policy Hub, and HuggingFace). Many of the FAQ below answer specific questions about the design of the survey questions.
Can I see the raw data files?
Yes. I am making all raw data from the survey available free of charge. The only condition is that if the data is reused, attribution is granted under a Open Data Commons Attribution License (ODC-By). The goal of sharing the data is to advance understanding of American public opinion on AI so that researchers, policy makers, and other interested parties have full insight to the public’s beliefs and attitudes about new Generative AI technologies.
Will there be future versions of this survey?
Yes. As funding allows I will continue to improve and iterate on the survey questions and work with NORC to administer future versions.
Can I contribute to questions in the next iteration of the survey?
Yes! No survey is perfect. If you have ideas about how the survey can be improved leave a comment below or email me at james@96layers.ai. If possible I will try to incorporate your suggestions.
Were questions and response options randomized?
Yes. It is common practice to randomize questions and response options to avoid various kinds of survey bias.
Here is Harvard Professor Stefanie Stantcheva’s advice on randomization from her wonderful paper “How to Run Surveys.”
[T]he order in which response options are provided may not be neutral. Respondents may tend to pick the last answer (a “recency effect” most often encountered in phone or face-to-face surveys) or the first answer (a “primacy effect”). In addition to the advice of avoiding long lists of options and using forced-choice instead of select-all-that-apply, it makes sense to randomize the order of answer options for questions that do not have a natural ordering or where the ordering can be inverted.
Not all questions in the survey were randomized, but many were:
Question 3 was about excitement or concern over Generative AI. In Question 3 the order of the response options “More excited than concerned” and “More concerned than excited” were randomized so that each appeared first about half the time.
Question 4 was about the reason for excitement or concern. In Question 4 all response options were randomized for both versions.
Questions 5, 6, and 7 were about various policy proposals. The order that these questions were presented to respondents was randomized. Additionally, the order of each grid item within the questions was also randomized. All three questions were split across two screens for readability.
Question 8 was about the U.S. maintaining its lead in Generative AI. In Question 8 the scale was randomized so that half the time it started with “Strongly favor keeping our lead” and half the time it was reversed and started with “Strongly favor being cautious.”
Questions 9 and 10 were about job areas that would benefit or be hurt by Generative AI. The order that these questions were presented to respondents was randomized. Additionally, within each question the response options were randomized.
Why is the question wording so simple?
Throughout the survey you may notice that the wording of questions is intentionally simple, with short sentences and easy-to-understand language. The question phrasing can be so simple as to seem almost silly at times, but this was very intentional. Survey questions meant to be representative of all Americans need to be accessible to all Americans.
Keep in mind that because the NORC AmeriSpeak survey uses a probability-based, nationally representative panel, respondents have a variety of educational backgrounds. U.S. literacy rates are modest, so surveys need to be constructed to reflect this. Moreover, survey questions have to be simple enough so that the survey can be successfully administered over an automated landline phone system to account for respondents that do not have internet access (about 7% of Americans still don’t use the internet). In the 2023 Generative AI and American Society Survey 5% of respondents completed the survey by phone.
After the initial draft of the survey was completed a tremendous amount of time was put into simplifying the question wording to be as accessible as possible. As an example, here is the original and final version of Question 7b.
Question 7b original:
Countries that misuse AI technology to harm their citizens or threaten democratic values should face international consequences, such as sanctions. However, this approach could lead to less international teamwork on global problems. It might also cause negative economic impacts due to reduced trade between countries. Lastly, it could create diplomatic tensions among nations.
Question 7b final:
Idea: Some countries might misuse AI technology to harm their citizens or threaten democratic values. If they do, these countries should face global penalties, such as sanctions.
Benefit: This could deter nations from abusing AI technology. It might encourage them to follow global democratic principles.
Tradeoff: This could reduce teamwork among nations. Prices could rise from less global trade. It could also spark diplomatic tensions.
The tool Readable was used to assess the expected reach and Flesch-Kincaid Grade Level on a question-by-question basis. The goal was to make each survey question at or below a 9th grade level. According to Readable the overall survey has 100% with a Flesch-Kincaid Grade Level of 7.0.
How was the order of the questions chosen?
Here is Harvard Professor Stefanie Stantcheva’s describe’s question ordering in her wonderful paper “How to Run Surveys.”
In general, the ordering of the questionnaire needs to be guided by three (sometimes conflicting) concerns: i) Respondents are often more engaged and less tired earlier in the survey; ii) at the same time, questions that come earlier can influence responses to subsequent questions through the channels explained in Section 5.2; and iii) respondents form an opinion about your survey in the first few questions, and capturing their interest is critical. Therefore, balancing these three concerns, you must tailor the ordering to your specific question and setting. It is thus difficult to give general advice.
Questions 1 and 2 were about usage of new AI tools. These questions were asked first to help set the stage for the purpose of the survey.
Questions 3 and 4 were about excitement and concern. These questions were presented next to continue to build on usage before the policy-focused questions were presented. Additionally, reasons for excitement and concern about Generative AI are of primary interest to a wide audience and so I wanted to place these close to the beginning of the survey.
Questions 5, 6, and 7 were a set of policy questions. These questions are more cognitively demanding, but still important. It made sense to have these in the middle of the survey after Questions 1-4 had oriented respondents. They could have potentially gone last, but I didn’t want to put the most cognitively demanding questions at the end.
Question 8 is about the U.S. maintaining its lead. This was a stand-alone policy question that naturally fit after the larger set of related policy questions.
Questions 9 and 10 were about job impact areas. These could’ve been placed before the policy questions, but again I judged Questions 9 and 10 as less cognitively demanding so chose to place them at the end.
Question 11 is a natural follow-on to Questions 9 and 10 and so was therefore placed last.
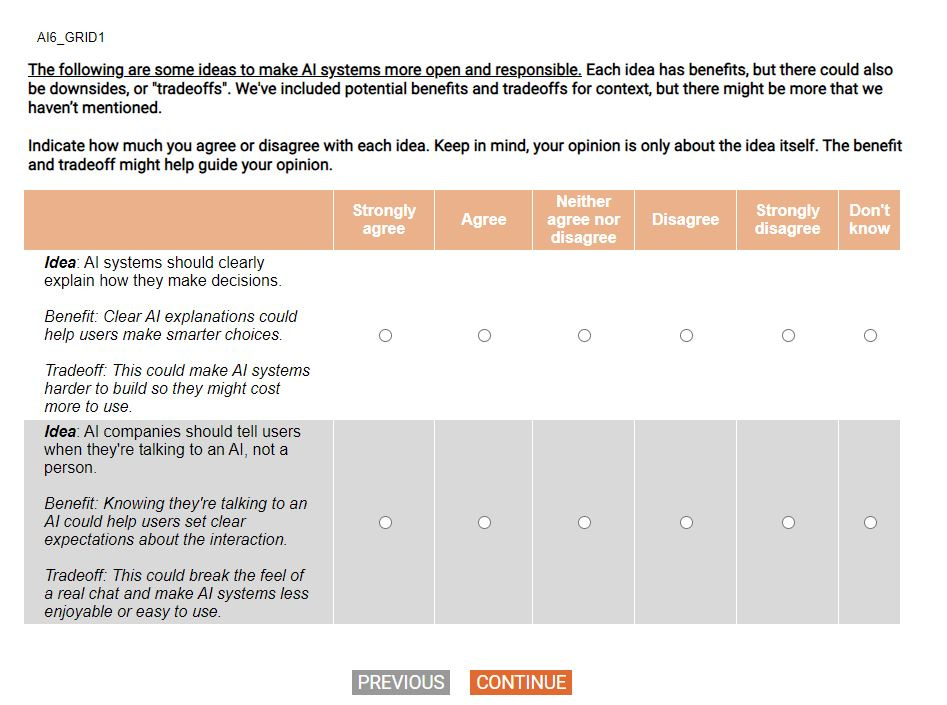
What did the survey questions look like for respondents?
Below is an example of a grid policy question that was presented to respondents.
Why is there white space before some survey responses?
Survey questions have a space before responses options. For example, Question 8 has a space between the set of five main options and “I don’t know.” The reason for this is to match the visual midpoint (“Neutral”) and the contextual midpoint (also “Neutral”). Including “I don’t know” along with the five main response options creates a discontinuity in this respect as “Neutral” remains the contextual midpoint, but is no longer the visual midpoint. Aligning the two reduces cognitive burden and makes the survey friendlier to respondents.
Think about the U.S. keeping its global lead in Generative AI. Benefits could include better living standards, strong economic growth, and improved national security. However, there might also be downsides like job losses, AI-driven cyberattacks, and misinformation created by AI. Given these benefits and downsides, where do you stand?
Strongly favor keeping our lead
Somewhat favor keeping our lead
Neutral
Somewhat favor being cautious
Strongly favor being cautious
I don't know
Contrast Question 8 with the simple survey below from Google. Here the contextual midpoint is “Neutral” but the visual midpoint is “Somewhat Likely.”

Once a space was added before “I don’t know” for Question 8, the same strategy was applied to other questions to maintain continuity.
Even cases without a clear contextual midpoint separating sets of response options improves flow. Consider Question 1, which has all usage options related to frequency in a grouping and a second set of options relating to nonuse. The two sets are separated by a space.
Think about the past three months. In an average month, how often have you used language-based AI systems? These are systems that can chat like a human and perform other tasks such as writing computer code. Examples include ChatGPT by OpenAI, Bard from Google, and Bing Chat from Microsoft.
Every day
Several times a week
Once a week
1-3 times a month
I have tried them but did not continue using them.
I'm aware of them, but I have not used them.
I've never heard of them.
Why benefits and tradeoffs are included in policy questions?
Questions 5, 6, and 7 of the survey dive into a number of policy questions. These are presented as “Ideas” since their proposals. I had several conversations with NORC about the best way to structure these questions. Initially, the questions presented the policy, but cautioned that there were tradeoffs. Here’s what question 5d initially looked like:
AI-generated content should be clearly labeled as such to inform the audience. However, this might reduce the perceived value or authenticity of the content, potentially leading to less engagement or interest from users.
The wording of this question is far too complex. This gets a grade of ‘D’ from Readable. As part of the language simplification I also decided to move the tradeoff to a separate line. Making the tradeoff more explicit and separate from the idea was inspired by a reviewer from the Centre for the Governance of AI. The point of the clarification is that the question is asking about agreement with the Idea itself, not the tradeoff.
The next version of the question looked like this:
Idea: Content created by AI should have a clear label saying it's AI-generated. AI-generated content includes images, videos, stories, and music.
Tradeoff: People might engage with content less if they know it's made by AI even if the content is useful or entertaining. That's because it could seem less genuine or appealing.
I also added an explicit direction to the question setup: “Keep in mind, your opinion is about the idea itself, not its tradeoff.” Further, I was able to eliminate two response options, one from Question X and one from Question X to …
Nonetheless, there was then concern from NORC that the tradeoff was explicit, but the benefit was not. A critique I agree with. There was also a suggestion to change the font type of the tradeoff to further emphasis it was for context only. I made these updates, which resulted in the following final format.
Idea: Content created by AI should have a clear label saying it's AI-generated. AI-generated content includes images, videos, stories, and music.
Benefit: This could enable users to understand content origins and make informed decisions.
Tradeoff: People might engage with content less if they know it's made by AI even if the content is useful or entertaining. That's because it could seem less genuine or appealing.
But concern then shifted to question complexity. Providing both a benefit and a tradeoff for a series of grid questions does add cognitive burden and increase the length of the survey. It could also be that some people read the tradeoff and benefit while others ignore it, creating a disparity in content.
Nonetheless I decided to keep both the benefit and the tradeoff. I felt it was important given prior research I had seen on how priming respondents to think about tradeoffs can substantially shift support for a policy. As one example support for federal student loan forgiveness was shown to change dramatically when respondents were presented with a set of tradeoffs compared to asking about abstract support without a tradeoff present. (See results below).

Tradeoffs are part of life and I wanted to include both a benefit and a tradeoff to represent that fact. I worried that without presenting tradeoffs there would be an abundance of agreement, especially given anxiety and media attention over Generative AI. I feared that for a substantial portion of respondents, any policy option that presented some way of restricting, regulating, or governing Generative AI might be met with an immediate “yes.” I wanted to interrupt the tendency by encouraging respondents to consider the benefits and tradeoffs of the Idea.
Why was forced choice used rather than “Select all that apply”?
Several questions presented a set of options and asked respondents to chose a single option. For example, here’s Question 9:
Which job area do you think will benefit the most from Generative AI in the next 3 years? For each job area we've given some example jobs, but there might be other jobs in the job area.
Creative jobs (Artists, Writers, Designers)
Media jobs (Game designers, Game programmers, 3D artists)
Performing arts (Movie and TV actors)
Finance jobs (Accountants, Stock analysts, Traders)
Tech jobs (Programmers, Data analysts, Engineers, IT)
Teaching jobs (Teachers, Course creators)
Legal jobs (Lawyers, Legal assistants)
Health jobs (Doctors, Nurses)
Sales and Marketing jobs
Other (please specify)
I don’t know
There with NORC about whether this question should instead be of the form, “Select all that apply.” The recommendation from NORC was that while choose-all-that-apply style questions have their place, forced choice is usually better. This aligns with Stantcheva’s advice as well:
For questions where there can be multiple answer options selected, you have to decide between using a “forced-choice” or a “check-all-that-apply” format. Forced-choice questions ask item by item and require respondents to judge all items presented independently. Check-all-that-apply formats list all options simultaneously and ask respondents to select some of the items presented (Smyth et al., 2006). Forced-choice questions generally lead to more items being selected and respondents thinking more carefully about the answer options. As discussed below, forced-choice questions will also circumvent the problem of order effects in the answer options, whereby respondents may be tempted just to select one of the first answers and move on without considering every choice. If you can, try to convert your “check-all-that-apply” questions into individual forced-choice questions.
Select-all-that-apply questions tend to lead to a lot of acquiescence. Consider a recent survey of misinformation experts administered by Harvard. The question asked respondents about how strongly they agree that a set of different factors cause people to believe misinformation. Overall, the survey is insightful for sure, and we do learn something about the experts’ opinions. Still, I wonder if this question would’ve been more useful presented as a forced choice, about what the main reason people believe misinformation. As it stands it’s
We know from the Piraña Principle that not all of these factors can be primary drivers of misinformation belief. Response patterns of the top five factors are almost identical and so we learn very little about how experts view the importance of these factors relative to one another. Should we tackle partisanship first or lack of trust in institutions?
